HOW TO TRACK AND IMPROVE YOUR TRADING PERFORMANCE
You can't improve what you don't measure. But measuring the wrong things wastes time and gives false confidence. Traders track all kinds of irrelevant data while missing the metrics that actually matter.
Here's what to monitor and how to use it.
The Metrics That Actually Matter
Win rate: What percentage of your trades are profitable? This is useful context, but not the whole picture. A 40% win rate can be highly profitable with the right risk-reward. A 70% win rate can still lose money if your losers are bigger than your winners.
Average win vs average loss: This tells you more than win rate alone. If your average winner is $200 and your average loser is $150, you can be wrong more often than right and still profit.
Expectancy: (Win rate × average win) - (loss rate × average loss). This is your expected profit per trade. Positive expectancy means your system makes money over time. Negative means you're slowly bleeding out.
Maximum drawdown: The worst peak-to-trough decline in your account. This tells you what you can realistically expect during losing streaks. If your max drawdown is 15%, you know rough patches can get at least that bad.
Return on invested capital: How much you're making relative to what you have at risk. 10% on $100,000 matters more than 50% on $1,000.
Tools for Tracking
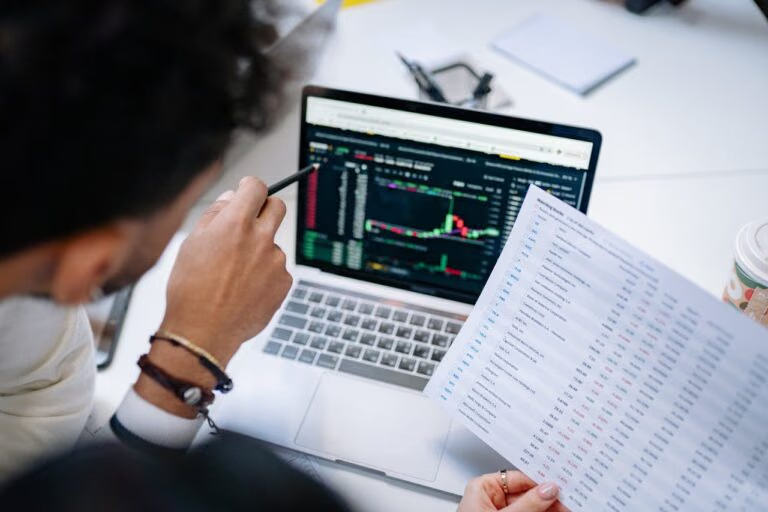
Spreadsheets: Free, customizable, and sufficient for most traders. Log every trade with entry, exit, size, result, and notes. Build formulas to calculate your metrics automatically.
Trading journals: Software like Tradervue or Edgewonk adds features spreadsheets don't have, automatic imports from brokers, tagging systems, and pre-built analytics.
Platform analytics: Your trading platform probably has built-in reporting. Use it for quick checks, but don't rely on it exclusively. Build your own tracking system that measures what matters to you.
How to Use the Data
Collecting data means nothing if you don't analyze it. Schedule weekly reviews, thirty minutes minimum.
Slice your trades different ways. Performance by day of week. Performance by time of day. Performance by setup type. Performance during trending vs ranging markets. Look for patterns you wouldn't see just checking your account balance.
When you find something actionable, like losing money every Friday, adjust. Stop trading Fridays. Then check whether the adjustment actually helped.
Building Feedback Loops
After every trade, answer three questions:
Did I follow my rules? Why did this trade win or lose? What would I do differently?
These answers compound over time. After a hundred trades, you've built a database of lessons that makes your next hundred trades better.
After every week, review the aggregate. Which setups performed best? Where did you break rules? What patterns emerged?
After every month, zoom out further. Are your metrics improving or degrading? Is your strategy still working in current market conditions?
The Point Isn't Just Data
Tracking is a means to an end. The goal is informed decision-making, knowing what to do more of and what to stop doing.
Traders who track properly improve faster because they're not guessing what's wrong. They know. That clarity is worth every minute spent logging and reviewing.
Skills Pay When Capital Backs Them
Good trading skills on a small account earn pocket change. The same skills on a funded account earn real income. SFX Funded bridges that gap.
Pass an evaluation (no time limits, no minimum trading days) and trade with up to $400K. Keep profit splits up to 100%. Payouts average under 8 hours. over 32,000 traders across 130+ countries already put their skills to work with SFX Funded.
Last updated